
ⴰⴼⴰⵢⵍⵓ:MeanMonthlyP.gif
ⵜⵉⴷⴷⵉ ⵏ ⵜⵎⵓⵖⵍⵉ ⴰⴷ: 800 × 496 ⵉⴷ ⴱⵉⴽⵙⵍ. ⵜⵉⴼⵙⴰⵢⵉⵏ: ⵢⴰⴹⵏ 320 × 198 ⵉⴷ ⴱⵉⴽⵙⵍ | 640 × 397 ⵉⴷ ⴱⵉⴽⵙⵍ | 1 200 × 744 ⵉⴷ ⴱⵉⴽⵙⵍ.
ⴰⴼⴰⵢⵍⵓ ⴰⵙⴰⵍⴰⵏ (1 200 × 744 ⵉⴷ ⴱⵉⴽⵙⵍ, ⵜⵉⴷⴷⵉ ⵏ ⵓⴼⴰⵢⵍⵓ: 1,09 MB, ⴰⵏⴰⵡ MIME: image/gif, looped, 12 frames, 12 s)
ⴰⵙⴳⵣⵍ
| ⴰⴳⵍⴰⵎ |
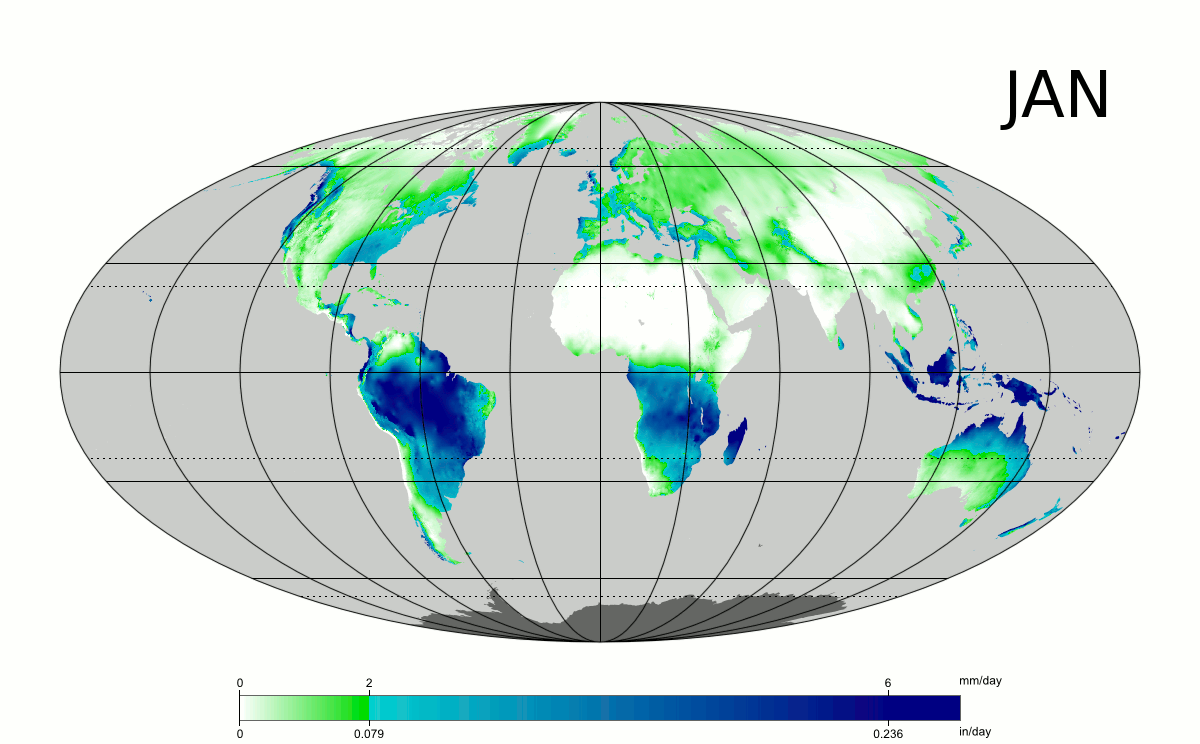
English: Long-term average precipitation by month (mm/day and in/day), based on 1961-1990 data. Animated GIF. Mollweide projection. |
| ⴰⵙⴰⴽⵓⴷ | February-March 2009 |
| ⴰⵙⴰⴳⵎ | Own work by uploader, sources: CRU CL 2.0 (New, M., Lister, D., Hulme, M. and Makin, I., 2002: A high-resolution data set of surface climate over global land areas. Climate Research 21: 1–25) and File:Tissot indicatrix world map Mollweide proj.svg by Eric Gaba. |
| ⴰⵎⴳⴰⵢ | PZmaps |
| Other versions |
Derivative works of this file: |
|
ⵜⵓⵔⴰⴳⵜ
I, the copyright holder of this work, hereby publish it under the following licenses:
ⴰⴼⴰⵢⵍⵓ ⴰⴷ ⵉⵍⵍⴰ ⴷⴷⵓ ⵜⴼⴰⴷⵉⵡⵉⵏ ⵏⵜⵓⵔⴰⴳⵜ Creative Commons Attribution - Partage dans les Mêmes Conditions 3.0 (non transposée).
- ⵜⴳⵉⴷ ⵉⵍⴻⵍⵍⵉ:
- ⴱⴹⵓ – ⵉ ⵓⵙⵙⵏⵖⵍ, ⴰⴱⵟⵟⵓ ⴷ ⵓⵙⵎⵓⵜⵜⵢ ⵏ ⵜⵡⵓⵔⵉ
- ⵛⵛⴰⵔ – ⵉ ⵓⵙⵎⵙⴰⵙⴰ ⵏ ⵜⵡⵓⵔⵉ
- ⴷⴷⴰⵡ ⵜⴼⴰⴷⵉⵡⵉⵏ ⴰⴷ:
- ⴰⵎⴰⵙ – ⵉⵇⵇⴰⵏ ⴷ ⴰⴷ ⵜⴼⴽⴷ ⵓⵎⵍⴰⵏ ⵖⴼ ⵓⵎⴳⴰⵢ, ⵜⴼⴽⴷ ⴰⵙⵖⵏ ⵖⵔ ⵜⵓⵔⴰⴳⵜ, ⵜⵎⵍⴷ ⵉⵖ ⵉⵜⵜⵡⴰⵙⵏⴼⵍ. ⵜⵣⴹⴰⵔⴷ ⴰⴷ ⵜⵙⴽⵔⴷ ⵎⴽ ⴰⴷ ⵙ ⵜⵖⴰⵔⴰⵙⵜ ⵏⵏⴰ ⴷ ⵢⵓⵙⴰⵏ, ⵎⴰⵛ ⵓⵔ ⴷ ⴽⵔⴰ ⵏ ⵜⵖⴰⵔⴰⵙⵜ ⵉⵎⵎⴰⵍⵏ ⵎⴰ ⵙ ⴷ ⴰⵎⴳⴰⵢ ⴰⵔ ⴽ ⵉⵏⵏⴰⵍ ⵏⵖ ⴷ ⴰⵙⵎⵔⵙ ⵏⴽ.
- ⴱⴹⵓⵜ ⵎⴽⵍⵍⵉⵜ – ⵎⴽ ⵜⵙⵏⴼⵍⴷ ⵏⵖ ⵜⵙⵎⵓⵜⵜⵉⴷ ⵏⵖ ⵜⵥⴽⵉⴷ ⵖⴼ ⵜⵡⵓⵔⵉ, ⵉⵇⵇⴰⵏⴽ ⵉⴷ ⴰⴷ ⵜⴱⴹⵓⴷ ⵜⵓⵎⵓⵜⵉⵏ ⵏⴽ ⴷⴷⴰⵡ ⵜⵓⵔⴰⵇⵜ ⴰⵏⵏ ⵏⵉⵜ ⵏⵖ ⴽⵔⴰ ⵏ ⵜⵓⵔⴰⴳⵜ ⴷ ⵢⵓⵙⴰⵏ ⴷ ⵜⴷⵙⵍⴰⵏⵜ.

|
ⵖⵓⵔⴽ ⵜⵓⵔⴰⴳⵜ ⵏ ⴰⴷ ⵜⵙⵙⵏⵖⵍⴷ, ⴰⴷ ⵜⴱⴹⵓⴷ ⴷ ⴰⴷ ⵜⵙⵏⴼⵍⴷ ⵜⴰⵏⵜⴰⵎⵜ ⴰⴷ ⴷⴷⵓ ⵜⴼⴰⴷⵉⵡⵉⵏ ⵏ ⵜⵓⵔⴰⴳⵜ ⵊⵉⵏⵓ ⵉ ⵜⵏⵜⴰⵎⵉⵏ ⵜⵉⵍⴻⵍⵍⵉⵢⵉⵏ ⵜⵓⵏⵖⵉⵍⵜ 1.2 ⵏⵖ ⵜⵓⵏⵖⵉⵍⵜ ⵜⴰⵎⴰⵢⵏⵓⵜ ⴰⴽⴽ ⵏⵏⴰ ⵜⵥⵔⴳ ⵜⴰⵎⵔⵙⵍⵜ ⵏ ⵉⵙⵓⴼⵜⵡⵓⵔⵏ ⵉⵍⴻⵍⵍⵉⵢⵏ, ⵎⵉⵏ ⵜⵉⵣⵓⵏⵉⵡⵉⵏ ⴰⵔⵎⵙⴽⵉⵍⵏ, ⵎⵉⵏ ⴰⴹⵔⵉⵙ ⵏ ⵜⴰⵙⵏⴰ ⵜⴰⵎⵣⵡⴰⵔⵓⵜ ⵏ ⵜⴷⵓⵍⵉ ⴷ ⵎⵉⵏ ⴰⴹⵔⵉⵙ ⵏ ⵜⴰⵙⵏⴰ ⵜⴰⵎⴳⴳⴰⵔⵓⵜ ⵏ ⵜⴷⵓⵍⵉ.ⵢⴰⵜ ⵜⵓⵏⵖⵉⵍⵜ ⵏ ⵜⵓⵔⴰⴳⵜ ⵜⴽⵛⵎ ⴳ ⵜⵣⵓⵏⵉ ⵉⵍⴰⵏ ⴰⵣⵡⵍ GNU Free Documentation License. |
ⵜⵣⵎⵔⴷ ⴰⴷ ⵜⵙⵜⵉⴷ ⵜⵓⵔⴰⴳⵜ ⵏⵏⴰ ⵜⵔⵉⴷ.
]
ⴰⵎⵣⵔⵓⵢ ⵏ ⵓⴼⴰⵢⵍⵓ
ⴽⵍⵉⴽⵉ ⵖⴼ ⵓⵙⴰⴽⵓⴷ/ⴰⴽⵓⴷ ⵃⵎⴰ ⴰⴷ ⵜⵙⴽⵏⴷ ⴰⴼⴰⵢⵍⵓ ⵎⴰⵏⵎⴽ ⴰⴷ ⵢⴰⴷⵍⵍⵉ ⵉⴳⴰ ⴳ ⵡⴰⴽⵓⴷ ⴰⵏⵏ.
| ⴰⵙⴰⴽⵓⴷ/ⴰⴽⵓⴷ | ⵜⴰⵡⵍⴰⴼⵜ ⵎⵥⵥⵉⵢⵏ | ⵉⵎⵏⴰⴷⵏ | ⴰⵏⵙⵙⵎⵔⵙ | ⴰⵖⴼⴰⵡⴰⵍ | |
|---|---|---|---|---|---|
| ⴰⵎⵉⵔⴰⵏ | 03:41, 6 ⵎⴰⵕⵚ 2010 | | 1 200 × 744 (1,09 MB) | Aiyizo | Optimized animation using GIMP. |
| 20:29, 6 ⵉⴱⵔⵉⵔ 2009 |  | 1 200 × 744 (1,48 MB) | PZmaps | higher resolution | |
| 23:00, 25 ⴱⵕⴰⵢⵕ 2009 |  | 550 × 340 (450 KB) | PZmaps | {{Information |Description={{en|1=Animated global map of long term mean monthly precipitation (Mollweide projection)}} |Source=Own work by uploader, sources: [http://www.cru.uea.ac.uk/cru/data/hrg.htm CRU CL 2.0] (New, M., Lister, D., Hulme, M. and Makin, |
ⴰⵙⵎⵔⵙ ⵏ ⵓⴼⴰⵢⵍⵓ
ⵜⴰⵙⵏⴰ ⴰⴷ ⵜⵙⵎⵔⵙ ⴰⴼⴰⵢⵍⵓ ⴰⴷ:
ⴰⵙⵎⵔⵙ ⴰⵖⵣⵓⵔⴰⵏ ⵏ ⵓⴼⴰⵢⵍⵓ
ⵉⵡⵉⴽⵉⵜⵏ ⴰⴷ ⵢⴰⴹⵏⵉⵏ ⴰⵔ ⵙⵙⵎⵔⵙⵏ ⴰⴼⴰⵢⵍⵓ ⴰⴷ:
- ⴰⵙⵎⵔⵙ ⴳ ar.wikipedia.org
- ⴰⵙⵎⵔⵙ ⴳ ast.wikipedia.org
- ⴰⵙⵎⵔⵙ ⴳ az.wikipedia.org
- ⴰⵙⵎⵔⵙ ⴳ ba.wikipedia.org
- ⴰⵙⵎⵔⵙ ⴳ be-tarask.wikipedia.org
- ⴰⵙⵎⵔⵙ ⴳ be.wikipedia.org
- ⴰⵙⵎⵔⵙ ⴳ bn.wikipedia.org
- ⴰⵙⵎⵔⵙ ⴳ ca.wikipedia.org
- ⴰⵙⵎⵔⵙ ⴳ cs.wikipedia.org
- ⴰⵙⵎⵔⵙ ⴳ cv.wikipedia.org
- ⴰⵙⵎⵔⵙ ⴳ da.wikipedia.org
- ⴰⵙⵎⵔⵙ ⴳ da.wikibooks.org
- ⴰⵙⵎⵔⵙ ⴳ de.wikipedia.org
- ⴰⵙⵎⵔⵙ ⴳ diq.wikipedia.org
- ⴰⵙⵎⵔⵙ ⴳ en.wikipedia.org
- Atmospheric circulation
- Wet season
- Portal:Water
- Climate classification
- Wikipedia:Featured pictures/Natural phenomena/Weather
- Rain
- User talk:Nergaal/Archive 4
- User:Runningonbrains/Portal next month
- List of climate scientists
- User talk:PZmaps
- Portal:Weather/Selected article/18
- Wikipedia:Featured pictures thumbs/18
- Portal:Weather/Featured content/FP
- Wikipedia:Featured picture candidates/July-2009
- Wikipedia:Featured picture candidates/MeanMonthlyPrecipitations
- Wikipedia:Wikipedia Signpost/2009-07-27/Features and admins
- Portal:Weather/Featured content/FP/23
- Earth rainfall climatology
- Template:POTD/2010-10-10
- User:FlightTime/Workshop
- Wikipedia:Wikipedia Signpost/2009-07-27/SPV
- Portal:Weather/Selected article
- Template:Portal POTD/testcases
- Talk:Precipitation/Archive 1
- Wikipedia:Wikipedia Signpost/Single/2009-07-27
- ⴰⵙⵎⵔⵙ ⴳ es.wikipedia.org
- ⴰⵙⵎⵔⵙ ⴳ eu.wikipedia.org
ⵙⴽⵏ ⵓⴳⴳⴰⵔ ⵖⴼ ⵓⵙⵙⵎⵔⵙ ⴰⵎⴰⵜⴰⵢ ⵏ ⵓⴼⴰⵢⵍⵓ ⴰⴷ.